The Idea
Every concert I’ve been to since 2007 is somewhere in my digital exhaust — Spotify scrobbles, Google Calendar events, Ticketmaster confirmation emails, a few photos. None of it was organized. I wanted the full picture.
What It Became
178 confirmed shows across 18 years (2007–2025), visualized as an interactive timeline with multiple lenses:
- The Arc — Show distribution over time: discovery years, the NYC interlude, the explosion despite becoming a parent (29 shows in both 2023 and 2024)
- Your Venues — Terminal West leads with 17 shows. Preference for 800–1,100 cap rooms. The Eastern emerged post-2022
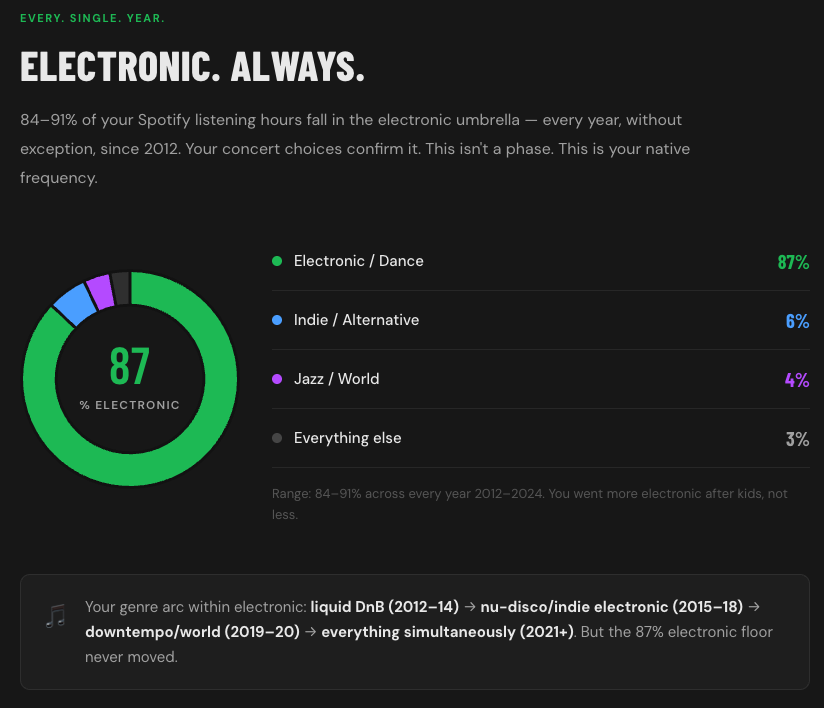
- Electronic. Always. — 84–91% of Spotify hours fall under the electronic umbrella every single year
- The Concert Squad — Cross-referenced with a 71-person CRM. 7 core music friends identified
- The Gap — Heaviest Spotify artists (Camo & Krooked: 62 hrs, Tosca: 52 hrs) never seen live
- Concert Calendar — Heatmap showing Feb–May and Sep–Nov peak touring windows